
Since our first article about inaccuracies within Google Analytics was such a success (Thanks, er, Google Analytics for letting us see this) we decided to do another installment! We still love Google Analytics. We promise!
As you may know, since the time of the first article, Google has unveiled Universal Analytics, an upgrade to GA with a more all-data-encompassing mission. Now, while some of the new features in UA offer solutions to the problems we discussed in our previous article (yes, we’re going to keep linking to it until you read it!) there are still a host of problems that remain.
But first, let’s see a couple of things that have been fixed:
The Good
Better Organic Search
Remember how we said that branded keywords shouldn’t count towards organic search? Well, Google listened! With UA, you have the option of listing keywords you want excluded from your organic traffic. Instead, traffic coming via these specified keywords are placed into your direct traffic. Implementing this change will help you get a better sense of how your visitors are discovering (and not merely navigating to) your site through organic search.
Better Referral Traffic
Does your site use a third-party site for your shopping cart or appointment registrations? If so, a new session will be created when the user returns to your site. On top of that, GA treats this third party site as a referral! That makes no sense! Using the referral exclusion list, you can help prevent these self-referrals from showing up in your referral traffic, and eliminate duplicate sessions. A nifty feature, if you ask us.
But now, the moment you’ve been waiting for…
The Bad
1. Your Sessions (Visits) may be over-estimated
So if you’re anything like me, you love perusing your company’s site and re-reading your past blog posts to revel in your ingenuity, as well as look for previously undetected spelling mistakes. However, these self-promoting sessions of mine would be inflating Whole Whale’s traffic numbers, if we didn’t have the proper filters set up! Thankfully, Google Analytics allows you to create filters in order to exclude certain segments of traffic. It is best to go ahead and exclude traffic coming from within your own company. After all, what you care about is how your customers and clients are using the site. Not employees.
All of your include and exclude filters can be found in the Filters section within your Admin Settings.
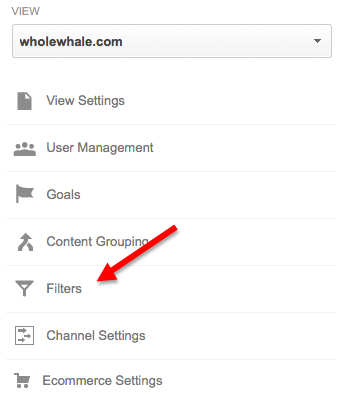
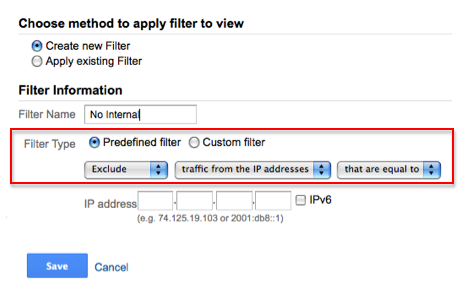
The most common method used to exclude internal traffic is to use IP addresses which correspond to your organization. An IP address is basically a unique identifier for computers. The computers being used within your organization will all have IP addresses within a certain range of possible values. Thus, excluding this range of values will serve to exclude your own internal traffic. Simply click on “Add New Filter” and tell Google to ignore traffic coming from your company’s IP Address.
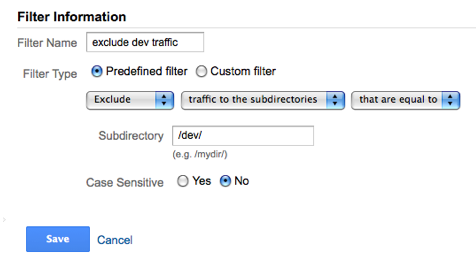
Another pro-tip is to exclude traffic from any “dev” versions of your site. That is, if your site is undergoing a redesign, you should definitely exclude traffic to the un-released, developing version of the site. After all, these visitors and sessions are all going to be coming from your developers. Check out the filter below that we created to help exclude this traffic. Because our developing site contains the same domain as our site, it is necessary to tell Google Analytics that these users aren’t visiting are actual, live site.
2. Your Sessions (Visits) may be under-estimated
Because Universal Analytics relies on Javascript to execute its tracking, a portion of users are simply not being counted. This is because they chose to have Javascript disabled for reasons related to privacy and security. Thus, visitors with Javascript disabled are effectively invisible when on your site and subvert your tracking capabilities.
Now, we didn’t mean to scare you. So, we’re going to provide you some resources to help get around this problem. First, check out this resource from Stack Overflow on how to estimate the number of your site’s visitors who have Javascript disabled. Then, be sure to read Moz’s tutorial on how to track these pesky disablers. Hopefully, these solutions will allow you to sleep more soundly at night.
3. In-page Analytics is a Mess
You’ve probably tried to use In-Page Analytics, but were scared off by its user-unfriendliness. We know. We’ve been there. To make matters worse, In-Page Analytics is pretty shoddy when it comes to analyzing clicks: If you have multiple elements on a page that link to the same page, UA simply combines these totals. This is because UA doesn’t have any on-page tracking capabilities, but rather uses things like previous-page-path to make inferences on what users are clicking. In other words, you can’t really determine which of your buttons is outperforming the other.
Fortunately, Google has an add-on feature called Enhanced Link Attribution which helps to remedy this problem for the most part. Still, if you’re looking to get a clearer picture of where exactly your users are clicking, check out CrazyEgg. Their interface is way more user friendly, and just look at how pretty this heat-map is.

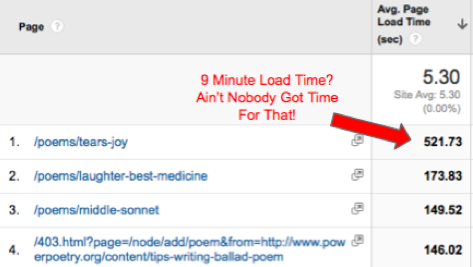
4. Avg. Load Time is overestimated
You’ve probably looked through the page timings section and gotten a mild heart attack when noticing the infuriatingly slow load time of some of your pages. We have some good news for you: it’s totally misleading! For starters, Google measures load time by seeing how long it takes for every element of your page to load. So, if the body text of your page loads super quickly, but then it takes another 15 seconds of loading for the social media buttons on your footer that no one clicks on anyways, this really isn’t such a big deal. The user experience is still fine, as she can read the content as it loads dynamically.
But what about the bots? And page ranking? Aren’t they going to penalize you for your slow pages? Actually, no. Moz did a thorough study and found no correlation between search ranking and page load time. What did matter though was Time-to-first-byte (TTFB). That is, how long it takes your browser to receive the first byte of a response from a web server when you request a particular URL. Our recommendation for assessing page speed is using Pingdom’s Free Speed Test Tool. It gives you a more descriptive overview of the different loading steps, and doesn’t just take a 1% sample of your users the way Google does.
5. Demographics and Interests is still a work in Progress
At this point, you should be familiar with the Demographic and Interests section of Google Analytics. It’s a nifty tool for visualizing your audience and can provide insights into how different populations convert. But alas, the data isn’t perfect. Not everyone volunteers their age and gender into their Google accounts, so what Google does often is make an educated guess. Using your browsing history and search queries, Google guesses what gender and age group you fall into, as well as what interests you have, but they’re not always accurate.
I wanted to see who Google thinks I am, so I clicked on the Ad settings for my profile. They got my age group and gender right, but my apparent interests were a little off. Cosmetics AND shooter games? Or maybe I’m just a more eclectic individual than I give myself credit for.

The Ugly
Give us our keywords, Google. Please.
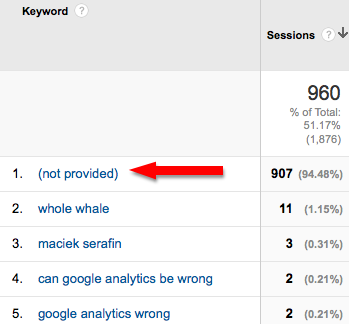
Ugh. It’s so hard to look at!
Again, we don’t mean to undermine the utility of Universal Analytics. Our hope is to simply inform users of its limitations and quirks. Armed with this knowledge, you can begin to interpret your data more accurately and successfully!
More Resources:
5 Ways Google Analytics Can Be Wrong
How To Set Up Google Analytics Filters
Google Analytics Mistakes